- Load the packages we will use.
- Read the data in the file
drug_cos.csvinto R and assign it todrug_cos
drug_cos <- read_csv("https://estanny.com/static/week5/drug_cos.csv")
- Use
glimpse()to get a glimpse of your data.
glimpse(drug_cos)
Rows: 104
Columns: 9
$ ticker       <chr> "ZTS", "ZTS", "ZTS", "ZTS", "ZTS", "ZTS", "Z...
$ name         <chr> "Zoetis Inc", "Zoetis Inc", "Zoetis Inc", "Z...
$ location     <chr> "New Jersey; U.S.A", "New Jersey; U.S.A", "N...
$ ebitdamargin <dbl> 0.149, 0.217, 0.222, 0.238, 0.182, 0.335, 0....
$ grossmargin  <dbl> 0.610, 0.640, 0.634, 0.641, 0.635, 0.659, 0....
$ netmargin    <dbl> 0.058, 0.101, 0.111, 0.122, 0.071, 0.168, 0....
$ ros          <dbl> 0.101, 0.171, 0.176, 0.195, 0.140, 0.286, 0....
$ roe          <dbl> 0.069, 0.113, 0.612, 0.465, 0.285, 0.587, 0....
$ year <dbl> 2011, 2012, 2013, 2014, 2015, 2016, 2017, 20...- Use
distinct()to subset distinct rows.
drug_cos %>%
  distinct(year)
# A tibble: 8 x 1
   year
  <dbl>
1  2011
2  2012
3  2013
4  2014
5  2015
6  2016
7  2017
8 2018- Use
count()to count observations by group.
drug_cos %>%
  count(year)
# A tibble: 8 x 2
   year     n
* <dbl> <int>
1  2011    13
2  2012    13
3  2013    13
4  2014    13
5  2015    13
6  2016    13
7  2017    13
8  2018    13
drug_cos %>%
count(name)
# A tibble: 13 x 2
   name                        n
 * <chr>                   <int>
 1 AbbVie Inc                  8
 2 Allergan plc                8
 3 Amgen Inc                   8
 4 Biogen Inc                  8
 5 Bristol Myers Squibb Co     8
 6 ELI LILLY & Co              8
 7 Gilead Sciences Inc         8
 8 Johnson & Johnson           8
 9 Merck & Co Inc              8
10 Mylan NV                    8
11 PERRIGO Co plc              8
12 Pfizer Inc                  8
13 Zoetis Inc                  8
drug_cos %>%
count(ticker, name)
# A tibble: 13 x 3
   ticker name                        n
   <chr>  <chr>                   <int>
 1 ABBV   AbbVie Inc                  8
 2 AGN    Allergan plc                8
 3 AMGN   Amgen Inc                   8
 4 BIIB   Biogen Inc                  8
 5 BMY    Bristol Myers Squibb Co     8
 6 GILD   Gilead Sciences Inc         8
 7 JNJ    Johnson & Johnson           8
 8 LLY    ELI LILLY & Co              8
 9 MRK    Merck & Co Inc              8
10 MYL    Mylan NV                    8
11 PFE    Pfizer Inc                  8
12 PRGO   PERRIGO Co plc              8
13 ZTS    Zoetis Inc                  8
##Use filter() to extract rows that meet criteria.
- Extract rows in non consecutive years.
# A tibble: 26 x 9
   ticker name  location ebitdamargin grossmargin netmargin   ros
   <chr>  <chr> <chr>           <dbl>       <dbl>     <dbl> <dbl>
 1 ZTS    Zoet~ New Jer~        0.222       0.634     0.111 0.176
 2 ZTS    Zoet~ New Jer~        0.379       0.672     0.245 0.326
 3 PRGO   PERR~ Ireland         0.236       0.362     0.125 0.19
 4 PRGO   PERR~ Ireland         0.178       0.387     0.028 0.088
 5 PFE    Pfiz~ New Yor~        0.634       0.814     0.427 0.51
 6 PFE    Pfiz~ New Yor~        0.34        0.79      0.208 0.221
 7 MYL    Myla~ United ~        0.228       0.44      0.09  0.153
 8 MYL    Myla~ United ~        0.258       0.35      0.031 0.074
 9 MRK    Merc~ New Jer~        0.282       0.615     0.1   0.123
10 MRK    Merc~ New Jer~        0.313       0.681     0.147 0.206
# ... with 16 more rows, and 2 more variables: roe <dbl>, year <dbl>- Extract every other year from 2012 to 2018.
# A tibble: 52 x 9
   ticker name  location ebitdamargin grossmargin netmargin    ros
   <chr>  <chr> <chr>           <dbl>       <dbl>     <dbl>  <dbl>
 1 ZTS    Zoet~ New Jer~        0.217       0.64      0.101  0.171
 2 ZTS    Zoet~ New Jer~        0.238       0.641     0.122  0.195
 3 ZTS    Zoet~ New Jer~        0.335       0.659     0.168  0.286
 4 ZTS    Zoet~ New Jer~        0.379       0.672     0.245  0.326
 5 PRGO   PERR~ Ireland         0.226       0.345     0.127  0.183
 6 PRGO   PERR~ Ireland         0.157       0.371     0.059  0.104
 7 PRGO   PERR~ Ireland        -0.791       0.389    -0.76  -0.877
 8 PRGO   PERR~ Ireland         0.178       0.387     0.028  0.088
 9 PFE    Pfiz~ New Yor~        0.447       0.82      0.267  0.307
10 PFE    Pfiz~ New Yor~        0.359       0.807     0.184  0.247
# ... with 42 more rows, and 2 more variables: roe <dbl>, year <dbl>- Extract the tickers “PFE” and “MYL”
# A tibble: 16 x 9
   ticker name  location ebitdamargin grossmargin netmargin   ros
   <chr>  <chr> <chr>           <dbl>       <dbl>     <dbl> <dbl>
 1 PFE    Pfiz~ New Yor~        0.371       0.795     0.164 0.223
 2 PFE    Pfiz~ New Yor~        0.447       0.82      0.267 0.307
 3 PFE    Pfiz~ New Yor~        0.634       0.814     0.427 0.51
 4 PFE    Pfiz~ New Yor~        0.359       0.807     0.184 0.247
 5 PFE    Pfiz~ New Yor~        0.289       0.803     0.142 0.183
 6 PFE    Pfiz~ New Yor~        0.267       0.767     0.137 0.158
 7 PFE    Pfiz~ New Yor~        0.353       0.786     0.406 0.233
 8 PFE    Pfiz~ New Yor~        0.34        0.79      0.208 0.221
 9 MYL    Myla~ United ~        0.245       0.418     0.088 0.161
10 MYL    Myla~ United ~        0.244       0.428     0.094 0.163
11 MYL    Myla~ United ~        0.228       0.44      0.09  0.153
12 MYL    Myla~ United ~        0.242       0.457     0.12  0.169
13 MYL    Myla~ United ~        0.243       0.447     0.09  0.133
14 MYL    Myla~ United ~        0.19        0.424     0.043 0.052
15 MYL    Myla~ United ~        0.272       0.402     0.058 0.121
16 MYL    Myla~ United ~        0.258       0.35      0.031 0.074
# ... with 2 more variables: roe <dbl>, year <dbl>
Use select() to select, rename, and reorder the columns.
- Select columns
ticker,nameandros
drug_cos %>%
  select(ticker, name, ros)
# A tibble: 104 x 3
   ticker name             ros
   <chr>  <chr>          <dbl>
 1 ZTS    Zoetis Inc     0.101
 2 ZTS    Zoetis Inc     0.171
 3 ZTS    Zoetis Inc     0.176
 4 ZTS    Zoetis Inc     0.195
 5 ZTS    Zoetis Inc     0.14
 6 ZTS    Zoetis Inc     0.286
 7 ZTS    Zoetis Inc     0.321
 8 ZTS    Zoetis Inc     0.326
 9 PRGO   PERRIGO Co plc 0.178
10 PRGO   PERRIGO Co plc 0.183
# ... with 94 more rows- Use
select()to exclude columnsticker,name, andros.
drug_cos %>%
  select(-ticker,-name, -ros)
# A tibble: 104 x 6
   location          ebitdamargin grossmargin netmargin   roe  year
   <chr>                    <dbl>       <dbl>     <dbl> <dbl> <dbl>
 1 New Jersey; U.S.A        0.149       0.61      0.058 0.069  2011
 2 New Jersey; U.S.A        0.217       0.64      0.101 0.113  2012
 3 New Jersey; U.S.A        0.222       0.634     0.111 0.612  2013
 4 New Jersey; U.S.A        0.238       0.641     0.122 0.465  2014
 5 New Jersey; U.S.A        0.182       0.635     0.071 0.285  2015
 6 New Jersey; U.S.A        0.335       0.659     0.168 0.587  2016
 7 New Jersey; U.S.A        0.366       0.666     0.163 0.488  2017
 8 New Jersey; U.S.A        0.379       0.672     0.245 0.694  2018
 9 Ireland                  0.216       0.343     0.123 0.248  2011
10 Ireland                  0.226       0.345     0.127 0.236  2012
# ... with 94 more rows- Rename and reorder columns with
select()
start with
drug_cosTHENchange the name of
locationtoheadquarterput the columns in this order:
year,ticker,headquarter,netmarginandroe
drug_cos %>%
  select(year, ticker, headquarter= location, netmargin, roe)
# A tibble: 104 x 5
    year ticker headquarter       netmargin   roe
   <dbl> <chr>  <chr>                 <dbl> <dbl>
 1  2011 ZTS    New Jersey; U.S.A     0.058 0.069
 2  2012 ZTS    New Jersey; U.S.A     0.101 0.113
 3  2013 ZTS    New Jersey; U.S.A     0.111 0.612
 4  2014 ZTS    New Jersey; U.S.A     0.122 0.465
 5  2015 ZTS    New Jersey; U.S.A     0.071 0.285
 6  2016 ZTS    New Jersey; U.S.A     0.168 0.587
 7  2017 ZTS    New Jersey; U.S.A     0.163 0.488
 8  2018 ZTS    New Jersey; U.S.A     0.245 0.694
 9  2011 PRGO   Ireland               0.123 0.248
10  2012 PRGO   Ireland               0.127 0.236
# ... with 94 more rows
Question: filter and select
Use inputs from your quiz question filter and select and replace SEE QUIZ with inputs from your quiz and replace ??? in the code
- start with
drug_cosTHEN - extract information for the tickers
AMGN,AGN,PFETHEN - select the variables
ticker,yearandros
# A tibble: 24 x 3
   ticker  year   ros
   <chr>  <dbl> <dbl>
 1 PFE     2011 0.223
 2 PFE     2012 0.307
 3 PFE     2013 0.51
 4 PFE     2014 0.247
 5 PFE     2015 0.183
 6 PFE     2016 0.158
 7 PFE     2017 0.233
 8 PFE     2018 0.221
 9 AMGN    2011 0.305
10 AMGN    2012 0.351
# ... with 14 more rows
Question: Rename
- start with
drug_cosTHEN - extract the information for the tickers
AMGNandBMY - select the variables
ticker,netmarginandroetoreturn_on_equity
drug_cos %>%
  filter(ticker %in% c("AMGN", "BMY")) %>%
  select(ticker, netmargin, return_on_equity= roe)
# A tibble: 16 x 3
   ticker netmargin return_on_equity
   <chr>      <dbl>            <dbl>
 1 BMY        0.175            0.229
 2 BMY        0.111            0.131
 3 BMY        0.156            0.177
 4 BMY        0.126            0.132
 5 BMY        0.095            0.104
 6 BMY        0.229            0.292
 7 BMY        0.048            0.072
 8 BMY        0.218            0.373
 9 AMGN       0.236            0.158
10 AMGN       0.252            0.225
11 AMGN       0.272            0.242
12 AMGN       0.257            0.21
13 AMGN       0.32             0.252
14 AMGN       0.336            0.259
15 AMGN       0.087            0.066
16 AMGN 0.353 0.585selectranges of columns
- by name
drug_cos %>%
  select(ebitdamargin:netmargin)
# A tibble: 104 x 3
   ebitdamargin grossmargin netmargin
          <dbl>       <dbl>     <dbl>
 1        0.149       0.61      0.058
 2        0.217       0.64      0.101
 3        0.222       0.634     0.111
 4        0.238       0.641     0.122
 5        0.182       0.635     0.071
 6        0.335       0.659     0.168
 7        0.366       0.666     0.163
 8        0.379       0.672     0.245
 9        0.216       0.343     0.123
10        0.226       0.345     0.127
# ... with 94 more rows- by position
drug_cos %>%
  select(4:6)
# A tibble: 104 x 3
   ebitdamargin grossmargin netmargin
          <dbl>       <dbl>     <dbl>
 1        0.149       0.61      0.058
 2        0.217       0.64      0.101
 3        0.222       0.634     0.111
 4        0.238       0.641     0.122
 5        0.182       0.635     0.071
 6        0.335       0.659     0.168
 7        0.366       0.666     0.163
 8        0.379       0.672     0.245
 9        0.216       0.343     0.123
10        0.226       0.345     0.127
# ... with 94 more rowsselecthelper functions.
starts_with("abc")matches columns start with “abc”ends_with("abc")matches columns end with “abc”contains("abc")matches columns contain “abc”
drug_cos %>%
  select(ticker, contains("local"))
# A tibble: 104 x 1
   ticker
   <chr>
 1 ZTS
 2 ZTS
 3 ZTS
 4 ZTS
 5 ZTS
 6 ZTS
 7 ZTS
 8 ZTS
 9 PRGO
10 PRGO
# ... with 94 more rows
drug_cos %>%
select(ticker, starts_with("r"))
# A tibble: 104 x 3
   ticker   ros   roe
   <chr>  <dbl> <dbl>
 1 ZTS    0.101 0.069
 2 ZTS    0.171 0.113
 3 ZTS    0.176 0.612
 4 ZTS    0.195 0.465
 5 ZTS    0.14  0.285
 6 ZTS    0.286 0.587
 7 ZTS    0.321 0.488
 8 ZTS    0.326 0.694
 9 PRGO   0.178 0.248
10 PRGO   0.183 0.236
# ... with 94 more rows
drug_cos %>%
select(ticker, ends_with("margin"))
# A tibble: 104 x 4
   ticker ebitdamargin grossmargin netmargin
   <chr>         <dbl>       <dbl>     <dbl>
 1 ZTS           0.149       0.61      0.058
 2 ZTS           0.217       0.64      0.101
 3 ZTS           0.222       0.634     0.111
 4 ZTS           0.238       0.641     0.122
 5 ZTS           0.182       0.635     0.071
 6 ZTS           0.335       0.659     0.168
 7 ZTS           0.366       0.666     0.163
 8 ZTS           0.379       0.672     0.245
 9 PRGO          0.216       0.343     0.123
10 PRGO          0.226       0.345     0.127
# ... with 94 more rows
Use group_by to set up data for operations by group
group_by
drug_cos %>%
  group_by(ticker)
# A tibble: 104 x 9
# Groups:   ticker [13]
   ticker name  location ebitdamargin grossmargin netmargin   ros
   <chr>  <chr> <chr>           <dbl>       <dbl>     <dbl> <dbl>
 1 ZTS    Zoet~ New Jer~        0.149       0.61      0.058 0.101
 2 ZTS    Zoet~ New Jer~        0.217       0.64      0.101 0.171
 3 ZTS    Zoet~ New Jer~        0.222       0.634     0.111 0.176
 4 ZTS    Zoet~ New Jer~        0.238       0.641     0.122 0.195
 5 ZTS    Zoet~ New Jer~        0.182       0.635     0.071 0.14
 6 ZTS    Zoet~ New Jer~        0.335       0.659     0.168 0.286
 7 ZTS    Zoet~ New Jer~        0.366       0.666     0.163 0.321
 8 ZTS    Zoet~ New Jer~        0.379       0.672     0.245 0.326
 9 PRGO   PERR~ Ireland         0.216       0.343     0.123 0.178
10 PRGO   PERR~ Ireland         0.226       0.345     0.127 0.183
# ... with 94 more rows, and 2 more variables: roe <dbl>, year <dbl>
drug_cos %>%
group_by(year)
# A tibble: 104 x 9
# Groups: year [8]
ticker name location ebitdamargin grossmargin netmargin ros
<chr> <chr> <chr> <dbl> <dbl> <dbl> <dbl>
1 ZTS Zoet~ New Jer~ 0.149 0.61 0.058 0.101
2 ZTS Zoet~ New Jer~ 0.217 0.64 0.101 0.171
3 ZTS Zoet~ New Jer~ 0.222 0.634 0.111 0.176
4 ZTS Zoet~ New Jer~ 0.238 0.641 0.122 0.195
5 ZTS Zoet~ New Jer~ 0.182 0.635 0.071 0.14
6 ZTS Zoet~ New Jer~ 0.335 0.659 0.168 0.286
7 ZTS Zoet~ New Jer~ 0.366 0.666 0.163 0.321
8 ZTS Zoet~ New Jer~ 0.379 0.672 0.245 0.326
9 PRGO PERR~ Ireland 0.216 0.343 0.123 0.178
10 PRGO PERR~ Ireland 0.226 0.345 0.127 0.183
# ... with 94 more rows, and 2 more variables: roe <dbl>, year <dbl>Use summarize to calculate summary statistics.
- Maximum
roefor all companies.
drug_cos %>%
summarize(max_roe= max(roe))
# A tibble: 1 x 1
max_roe
<dbl>
1 1.31- maximum
roefor eachyear
drug_cos %>%
group_by(year) %>%
summarize(max_roe= max(roe))
# A tibble: 8 x 2
   year max_roe
* <dbl>   <dbl>
1  2011   0.451
2  2012   0.69
3  2013   1.13
4  2014   0.828
5  2015   1.31
6  2016   1.11
7  2017   0.932
8 2018 0.694- maximum
roefor eachticker
drug_cos %>%
  group_by(ticker) %>%
  summarize(max_roe= max(roe))
# A tibble: 13 x 2
   ticker max_roe
 * <chr>    <dbl>
 1 ABBV     1.31
 2 AGN      0.184
 3 AMGN     0.585
 4 BIIB     0.334
 5 BMY      0.373
 6 GILD     1.04
 7 JNJ      0.244
 8 LLY      0.306
 9 MRK      0.248
10 MYL      0.283
11 PFE      0.342
12 PRGO     0.248
13 ZTS      0.694
Question: summarize
Mean for the year
- Find the mean ros for each year and call the variable
mean_ros - Extract the mean for 2013
# A tibble: 1 x 2
   year mean_ros
  <dbl>    <dbl>
1 2013 0.227- The mean for 2013 is .227 or 22.7%
Median for year - Find the median ros for each year and call the variable median_ros - extract the median for 2013
# A tibble: 1 x 2
   year median_ros
  <dbl>      <dbl>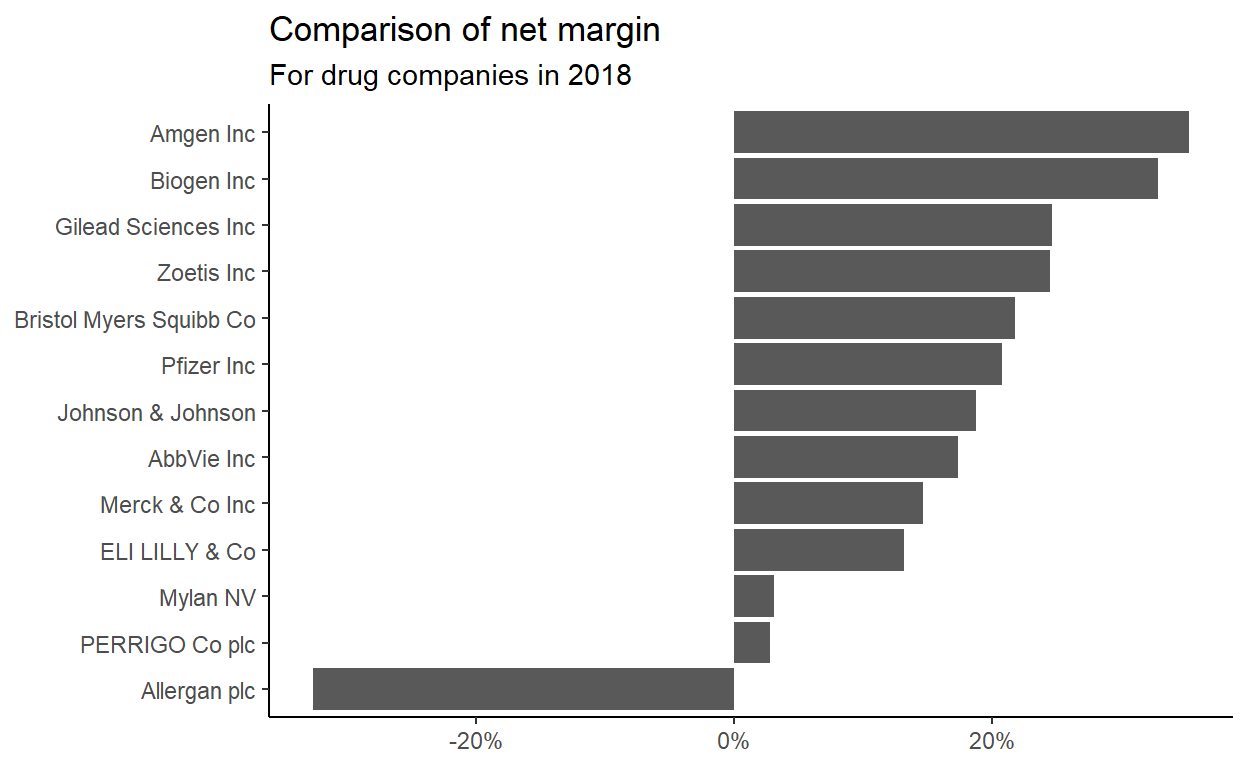
1 2013 0.224- Pick a ratio and a year and compare the companies.
 drug_cos %>%
  filter(year==2018) %>%
  ggplot(aes(x=netmargin, y=reorder(name, netmargin)))+
  geom_col() +
  scale_x_continuous(labels= scales::percent)+
  labs(title= "Comparison of net margin",
       subtitle = "For drug companies in 2018",
       x=NULL, y=NULL)+
  theme_classic()
ggsave(filename = "preview.png",
path= here::here("_posts", "2021-03-08-data-manipulation"))
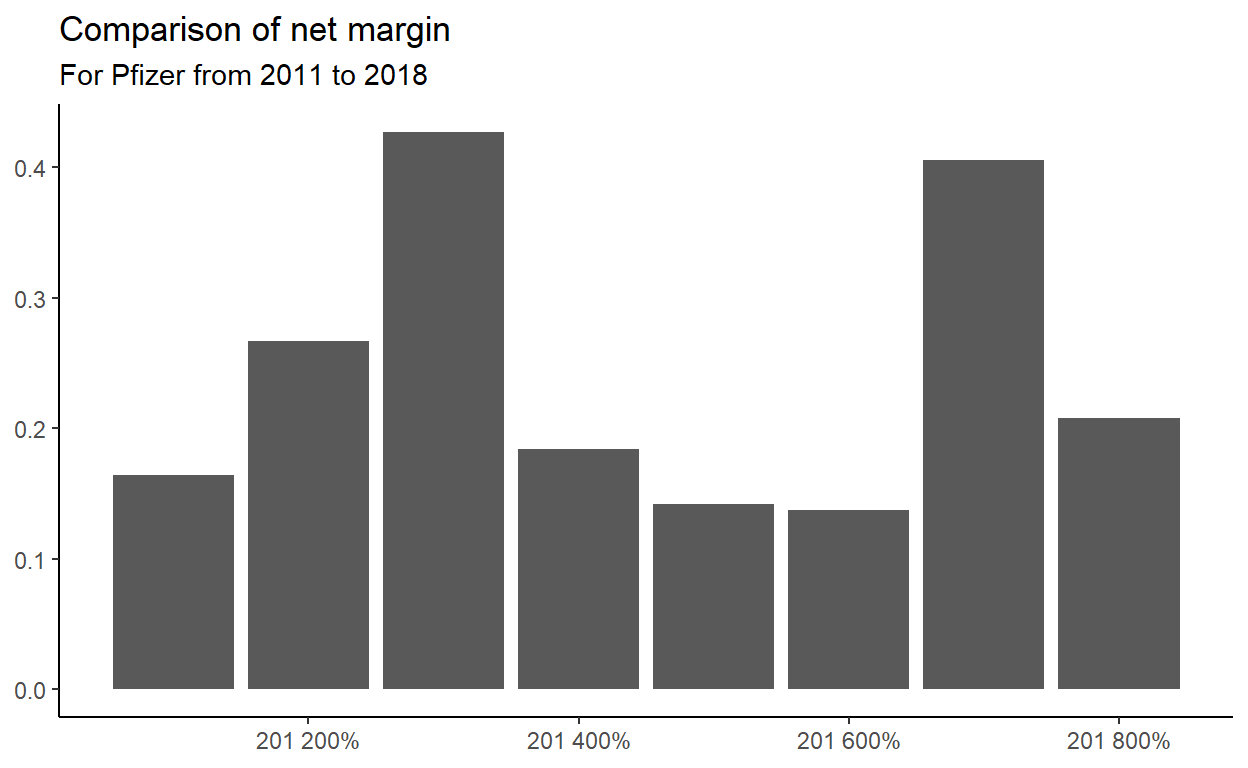
- Pick a company and a ratio and compare the ratio over time.
drug_cos %>%
  filter(ticker== "PFE") %>%
  ggplot(aes(x= year, y= netmargin)) +
  geom_col() +
  scale_x_continuous(labels= scales::percent) +
  labs(title = "Comparison of net margin",
       subtitle = "For Pfizer from 2011 to 2018",
       x=NULL, y=NULL) +
  theme_classic()
ggsave(filename = "preview.png",
path= here::here("_posts", "2021-03-08-data-manipulation"))